The returns are there. The access is not.
Private equity has a liquidity problem, not a performance problem. The real question has always been who manages your capital.
The past two years have produced an unusual volume of pessimistic commentary on private equity. Distributions are low. Exits are slow. The asset class was pushed toward retail investors in products that were never designed for them, and some of those products are now facing redemption pressure. Journalists and commentators have framed this as evidence that PE is in structural decline.
That framing is wrong, and it is worth understanding precisely why.
Private equity has a liquidity problem, not a return problem. It has a concentration problem in 2025 deal activity, not a market failure. And it has an access problem that has always existed but is now more consequential than at any point in the last two decades. None of these are reasons to reduce a well-constructed PE allocation. Several of them are reasons to be more selective about how you build one.
2025: A Record Year With an Asterisk
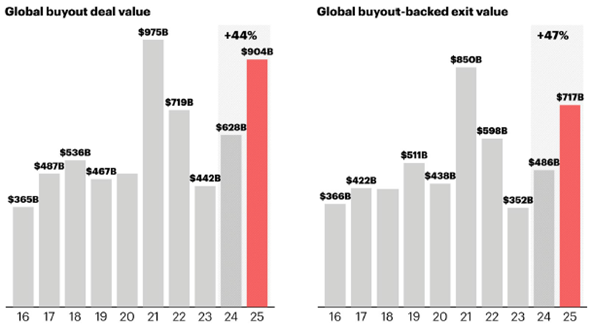
Global buyout deal value reached $904 billion in 2025, up 44% from the prior year and the second-highest total ever recorded. Exit value climbed to $717 billion, a 47% increase. On the surface, this is a strong recovery narrative.
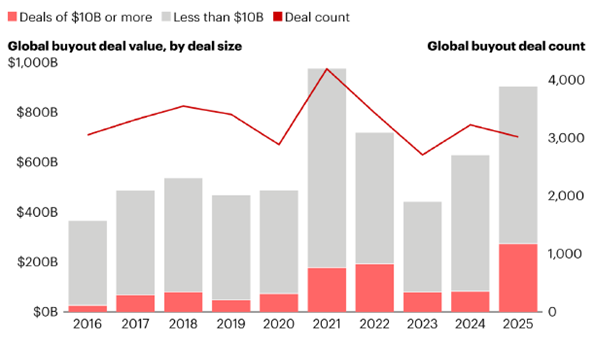
The asterisk is significant. Thirteen mega-deals, each above $10 billion, accounted for 69% of the volume growth. Overall deal count fell 6%. The recovery is real but it is highly concentrated at the top of the market. Mid-market and lower-mid-market activity remains more subdued. This distinction matters for investors: the publicly visible PE rebound of 2025 is predominantly a large-cap phenomenon, and large-cap PE carries a meaningfully different risk-return profile than the segments where the historical premium has been most consistent.
The Liquidity Question Everyone Is Asking
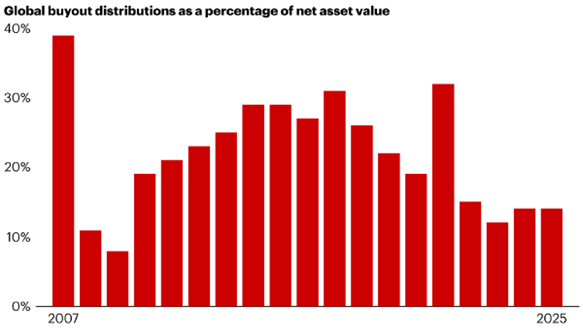
Distributions as a share of net asset value have remained at approximately 14% for four consecutive years. That is the lowest sustained level since the 2008-2009 financial crisis, when the PE industry was a fraction of its current size. The comparison is structurally misleading: in 2009, low distributions reflected market seizure and forced holding. Today, they reflect a deliberate and rational response to an exit environment where IPO markets have been largely closed and strategic buyers face their own financing constraints.
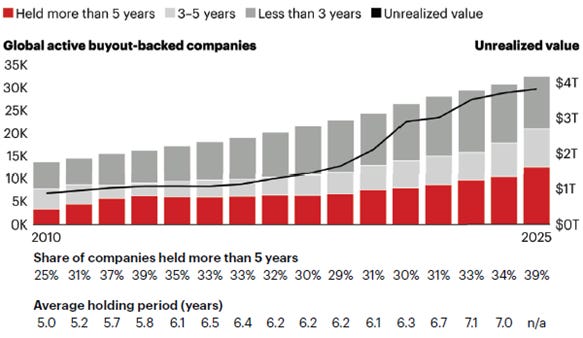
The consequence is visible in the portfolio data. The industry holds approximately $3.8 trillion in unrealized NAV across roughly 32,000 active buyout-backed companies. The share held for more than five years has risen to 39%, against a long-run average closer to 25-30%. Average holding periods are approaching seven years. Capital that would historically have been returned and redeployed is sitting on balance sheets waiting for exit conditions to normalize.
This is a liquidity problem. For investors who sized their PE allocations correctly relative to their overall liquidity needs, it is a timing inconvenience. For investors who over-allocated or who invested in structures that promised liquidity the asset class cannot provide, it is a genuine problem. The lesson is not that PE is broken. It is that PE was sold to the wrong investors.
The New Math of Buyouts
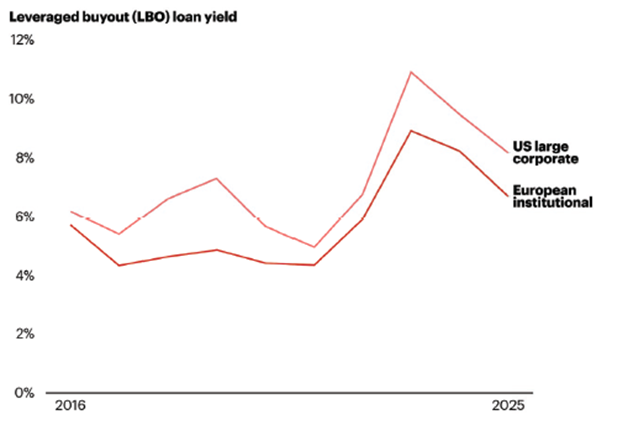
The financing environment has changed in ways that do not reverse quickly. LBO loan yields, both US large corporate and European institutional, rose sharply after 2022 and have stabilized at levels roughly 300-400 basis points above where they sat for most of the previous decade. The era when cheap leverage could do a significant portion of the return work is over.
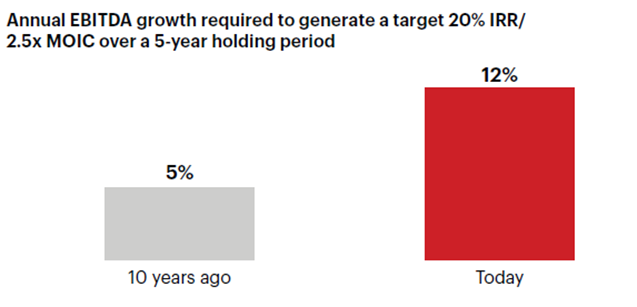
The arithmetic consequence is direct. Generating a 2.5x MOIC over a five-year holding period required approximately 5% annual EBITDA growth a decade ago, when acquisition multiples were similar but financing costs were substantially lower. The same target today requires 10-12% annual earnings growth. That is a materially higher operational bar, and it separates GPs who built their track records on financial engineering from those who built them on genuine operational value creation. The former cohort will struggle. The latter remains highly competitive.
For vintage years 2017-2020, DPI relative to historical benchmarks has also fallen short. These funds are not impaired, but they are returning capital more slowly than their predecessors, which affects LP cash flow planning and commitment pacing.
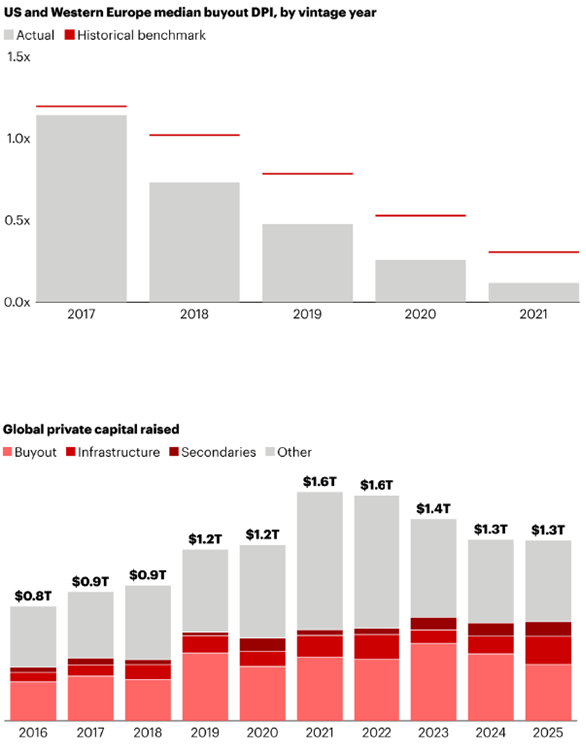
Despite the more challenging environment, capital continues to flow into the asset class. Global private capital raised held at $1.3 trillion in 2025, roughly in line with 2024 and well above pre-2020 levels. Institutional conviction in the asset class has not wavered. What has changed is that the capital is concentrating more aggressively toward established GPs with proven operational capabilities.
Why Manager Selection Has Become the Central Variable
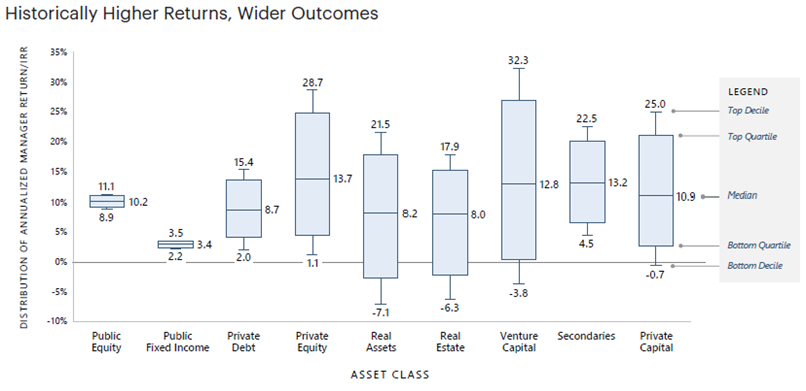
Private equity has always exhibited wide return dispersion across managers. What the current environment has done is make that dispersion consequential in a way it was not when even mediocre GPs could generate acceptable returns through multiple expansion and cheap debt.
The numbers are stark. The gap between top-decile and bottom-decile managers in PE exceeds 30 percentage points of annualized IRR. The equivalent gap in public equity is approximately 2 percentage points. In private real estate and infrastructure, dispersion is meaningful but substantially narrower than in PE and venture capital.
The implication is direct: the median PE fund, net of fees and accounting for illiquidity, frequently fails to justify the allocation. The top-quartile fund generates returns that are structurally unavailable through listed markets. These two facts coexist, and they explain why the access question has moved from secondary to central.
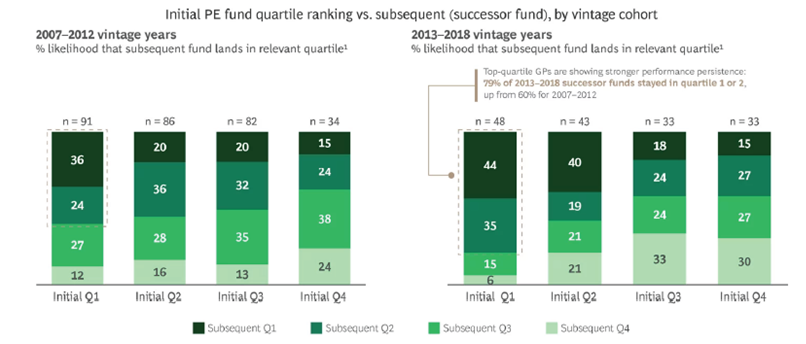
Performance persistence has also strengthened. Among GPs who ranked in the top quartile during the 2013-2018 vintage cohort, 79% remained in the top two quartiles with their subsequent fund, up from 60% for the 2007-2012 cohort. This is a meaningful shift. It suggests that top-quartile status is increasingly a durable characteristic rather than a vintage-year accident. It also means that the investors who already have access to those managers have a compounding structural advantage.
The Long-Term Case Has Not Changed
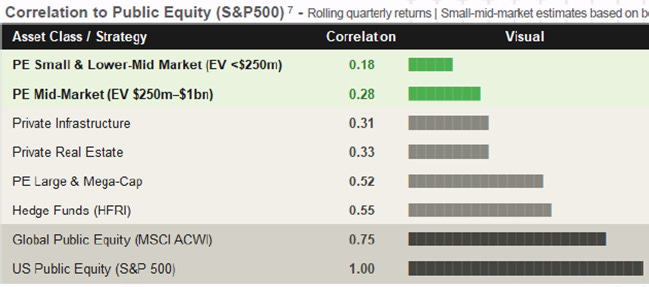
Small and lower-mid-market PE maintains a correlation to public equity of approximately 0.18. PE mid-market sits at 0.28. For comparison, global public equity (MSCI ACWI) runs at 0.75 against the S&P 500. The diversification benefit, particularly in the smaller segments of the market, remains one of the most robust characteristics of the asset class and one of the least affected by the current environment.
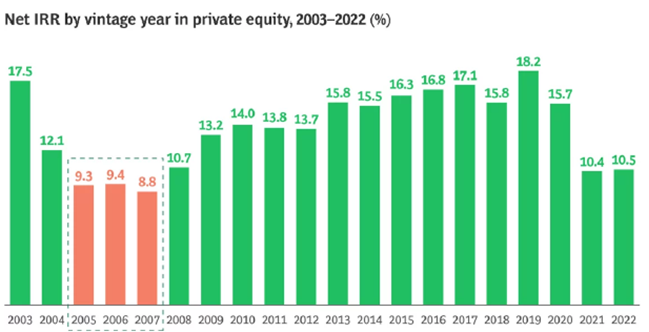
The historical IRR data across two decades is equally consistent. Net returns by vintage year have ranged from roughly 9% to 18%, with only the 2005-2007 vintages, which captured the peak of the pre-crisis leverage cycle, falling materially below long-run expectations. More importantly, an investor who simply committed consistently across all vintage years, including the three worst, would have captured an annualized premium of approximately 2.3-4.8% over public equity. Vintage timing, as a strategy, adds very little value. Consistent commitment to quality managers adds a great deal.
What the Smartest Money Actually Does
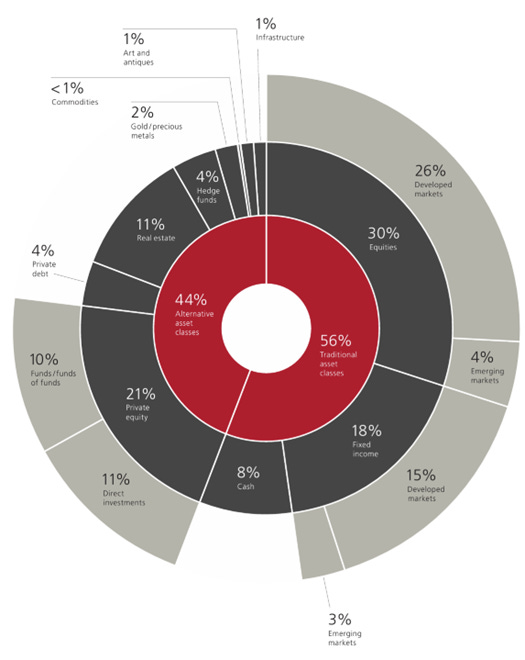
Family offices, the investor segment with the longest time horizons, the highest sophistication, and the fewest regulatory constraints on illiquidity, allocate approximately 44% of their portfolios to alternative asset classes. Within alternatives, private equity at 21%, real estate at 11%, and direct investments at 11% dominate. This is not an allocation built on marketing. It is an allocation built on decades of observed return data and hard-won access.
For UHNW investors structuring a portfolio today, a reasonable framework looks similar: 20-22% in private equity within a total alternatives allocation of 40-50%, complemented by real estate at 10-12%, hedge funds at 4-5%, and private debt at 3-5%. The specific weights depend on liquidity needs, existing public market exposure, and critically, the GP relationships available to each investor.
The Real Question
Private equity has been democratized in the sense that more products now offer nominal exposure to the asset class. It has not been democratized in the sense that access to top-quartile managers has become easier. Those managers are typically closed to new LPs, accessible only through established relationships, and increasingly selective about the capital they accept.
For an UHNW investor with genuine access to those managers, the case for a significant and sustained PE allocation is stronger than the current headlines suggest. The operational bar is higher, the financing tailwind is gone, and distributions will remain slow until exit markets normalize. None of that changes the fundamental arithmetic: over a full cycle, with the right managers, private equity delivers a verified and substantial premium over public markets that no listed product currently replicates.
The question worth asking is not whether to allocate to PE. It is whether you have access to the managers that make the allocation worthwhile. A useful test: if you cannot name the specific GPs in your portfolio and explain why each was selected over alternatives, you likely have exposure rather than an allocation. That distinction matters more today than at any point in the last decade. If you are working through it, the comments are open.
Sources: Bain & Co Global Private Equity Report 2026, Hamilton Lane Market Overview 2025, Apollo After 60/40 2026, BCG Private Equity Advantage is Shifting, not Shrinking 2026, Swise Navigating Uncertainty 2026, Cambridge Associates, UBS Global Family Office Report 2025, Long Angle High Net Worth Asset Allocation Study 2026, Campden Wealth The Ultra High Net Worth Private Equity Investing Report 2023. Analysis: edogust.
This article is for informational purposes only and does not constitute investment advice.